Organization of the I/O files and folders
General information:
Input graphs: Do NOT put any data graph in the ONTOLOGY folder, and do NOT put ontology graphs in the DATA folder. This would break the very logic of the converter, which expects a clear partition.
Output folders: The preferred approach is to have two folders, one which will be used as output for the verbose mode, and one for the production mode. The input (RDF graph) files should all be descendants of a unique folder. The converter will load incrementally in a single graph all .ttl files found below the starting point (exploring recursively the subfolders and following symlinks). Thus, you should remove the undesired graphs or zip them.
ONTOLOGY CONVERSION INPUT
The reading of input RDF graphs (default is turtle format, configurable) happens recursively from the specified folders (see configuration files). If using a Docker container, take into account the volume bound to your host $(ONTOLOGY) should not contain RDF graphs but rather a main_ontologies folder containing RDF graphs (which can be in subfolders, this part is more flexible)
Folder names are configurable in graph_config.json. (See Configuration)
Using external terminologies
Asidet to the main_ontologies folder, you can specify a terminology folder containing extra graphs such as external terminologies. You can also put them directly in your main_ontologies hierarchy but having them separate will improve the graph parsing resource usage.
Important
Do NOT put any data graph in the ONTOLOGY folder, and do NOT put ontology graphs in the DATA folder. This would break the very logic of the converter, which expects a clear partition.

All RDF graphs under the $(ONTOLOGY)/main_ontologies will be parsed and converted into the output i2b2 ontology. The external_terminologies folder should be used for storing large terminologies that are complementary to the main ontology graph.
DATA CONVERSION INPUT
All RDF graphs under the specified folder are parsed and converted to i2b2 data records. It is possible to add an entrypoint to a terminology files for units ; it will be parsed with the data graphs.

Data graphs and unit graphs will be loaded together, the folder distinction is only for clarity. The only important thing is that no ontology graph should be present in either hierarchy.
Batch conversion for large (>4GB) datasets
Due to the overhead of the rdflib Python library, it is likely that a 32-GB RAM gets overloaded when trying to convert more than ~4GB of data samples at once.
We offer a divide-and-conquer shell script that takes patient-based partitions of the datasets and repeatedly triggers data conversions run on each batch before merging all the outputs together. Please refer to the in-file comments of the converter-merger.sh script present in the data converter Docker repository
OUTPUT TABLES
The data converter optionally reads ontology tables for QA. For this (recommended) sanity check to be automatically performed, the converted ontology tables (in fact, only CONCEPT_DIMENSION and MODIFIER_DIMENSION) need to be present in the data converter destination folder. Details about this procedure and why we have two lookalike output folders are explained in the Verbose tables page.
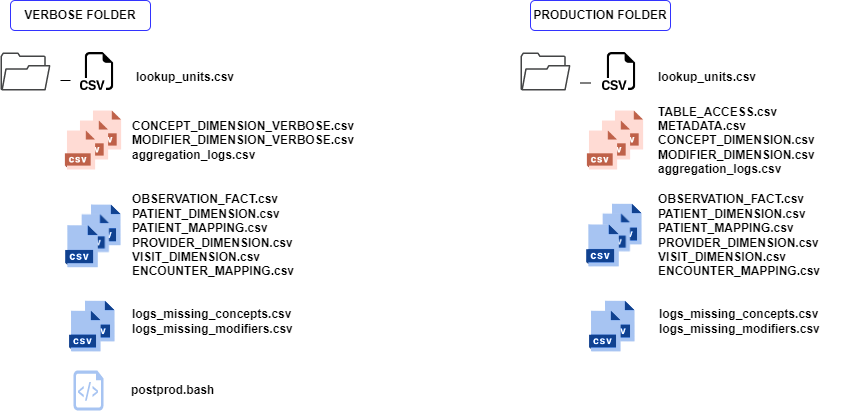
Composition of the output folders for both converters. Black icons figure files that will be taken into account by the ontology converter if present BEFORE the run ; Red icons are outputs of the ontology converter andcan be used for quality assessment after data conversion ; Blue icons are outputs of the data converter.
Loading into i2b2
All the CSV files of the PRODUCTION folder with upper-case names should be loaded into the i2b2 database.